In this document we will continue the presentation on KPI’s in the aluminum can industry, focusing now on waste control in a production line.
For the example we will use the “standard line” presented in the above mentioned publication. Line composed of 1 Cupper 15 outs, 10 BM’s 400 c.p.m, 1 Washer, 2 Printers 2000 c.p.m, 10 I/Spray 400 c.p.m, 1 Necker 3.400 c.p.m, 1 Palletizer 4000 c.p.m.
The first point I would like to address is how to calculate waste on the production line.
The denominator standard is for total cans approved, i.e., only good cans approved for sale, and not the total volume produced.
The total wastage for the month, for the entire production line, would be calculated as follows by the total cups produced and the total cans produced approved, i.e.:
MONTHLY WASTE = (TOTAL CUPS) / (TOTAL CANS APPROVED) – 1.
If a plant at the end of the month produced 103 million cups and had a Palletizer production of 101 million, being approved for sale 100 million cans, with 1 million in HFI:
Waste of the month = 103/100 – 1 = 3% (calculated waste in the month)
For the supervisory system, we often do not have the calculation of the HFI (hold for inspection), which are the cans retained by Quality due to some non-conformity, usually controlled within the MRP system (SAP, BPCS, etc.). That is why we suggest in the supervision system to adopt the total volume of cans produced in the Palletizer as the denominator.
In order to have the total number of cans lost in each production stage, we need to establish some measurement standards, which we will suggest for each stage:
CUP MANUFACTURING
We can consider that the total number of lost cups will be equal to the total of One Stroke x number of press outs, so if during the period considered a press had a total of 20 One Strokes given by the operator, we would have 300 cups lost in the process. Production is calculated by total strokes x total die outs.
BODY FABRICATORS – redrawing and ironing of the can wall body.
The vast majority of BM’s have a count of cups fed, so we can use as input production the total of cups fed and as output the total measured by a can counter sensor installed just after the trimmer, measuring the waste of the BM + trimmer set. Ideally, the cups are also measured with a sensor in the cup drop funnel, installed before the cup extraction gate, so in case of metal problems, the total cups removed due to the HFI coil (short can problems) will be counted. If you want the number of cups discarded due to HFI coil, you can check the difference between the cups fed to the BM and the cups measured by the sensor. These cups lost due to HFI could be shown in
DIAGNOSIS – CUPPER.
For each machine, a can sensor on the exit gate of each trimmer, after the “Discharge Gate Jam” gate, allows the system to count the difference between the total cups and the total number of cans that have left the trimmer. The waste of each machine will be the result of this total of cans wasted, times the total number of cans that came out of the machine after the trimmer, but in the OVERVIEW screen we measure the waste of the Body Maker process by the sum of the total cans wasted in the BM’s times the total production of the Palletizer.
It is very common to have discrepancies in waste between BM’s, since the performance of the Trimmer is highly dependent on the quality of the can produced by its conjugate BM. Therefore, I would recommend in the OVERVIEW SCREEN the basic data of each BM/Cutter available for the Supervisor’s view. The average value will not differ from that presented in the OVERVIEW, as can be seen in the screen examples presented in this document.
WASHER – Surface Preparation of Cans for Painting
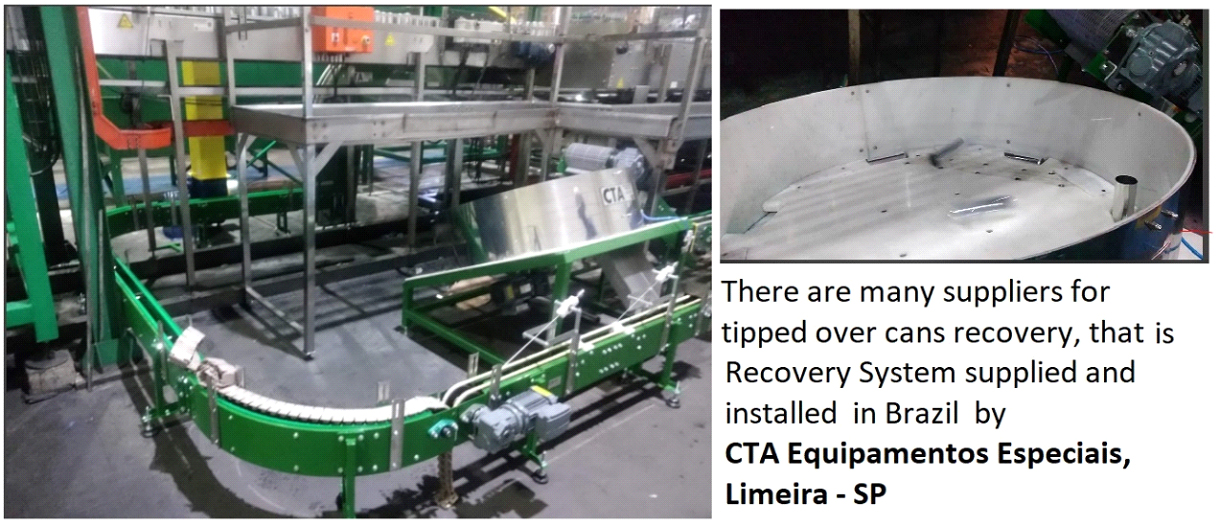
It is difficult to be accurate in the production of the Washer, and as the good saying goes, those who don’t measure don’t control and those who mismeasure get out of control, so I would recommend controlling the total number of dumped cans that are recovered and those that are discarded in the recovery system by checking and removing damaged cans, before returning to the Washer inlet. Damaged cans that are ejected will be counted as wastage from the Washer, and the total number of cans recovered will be used to keep track of whether there is a problem. Typically, the total number of cans dumped will be low, less than 10 thousand/day. If you are recovering more than this, you may have a problem with the conveyors between the BM’s and the Washer inlet. With a trimmer ring catching on a dead plate, you can lose more than 2 pallets in a single shift.
An improperly positioned or clogged nozzle can also cause large losses, in addition to quality problems such as ME, which occur when there is an excess of overturned cans entering or falling into the washing process.
If 10,000 cans are recovered in a washing machine, it would not be unusual to have 1,000 cans crushed during transport. This type of control is also important because cans with a damaged mouth, due to pressure against overturned cans, lead to having excess trips in the printers which thus generate more waste in the printers. Therefore, the control of what is listed in the Washers is very relevant.
PRINTERS – Application of labels and varnish on cans
We would recommend measuring infeed and outfeed using can count sensors, 1 at the printer inlet, at the single channel start hopper, another sensor after the transfer wheel and another sensor at the Stripper Off outlet after the Pin Oven. Printer and Pin Oven losses should be measured.
As with the BM’s, it is good that the output of each of the printers is presented on the OVERVIEW screen, and the printer and Pin Oven waste is calculated by the production at the Stripper Off output, individually. The waste of the printing process will be calculated by the sum of the two printers/Pin Ovens presented on the OVERVIEW screen times the output of the Palletizer.
Individualizing each printer makes it easier to detect discrepancies between the two machines – a pin chain with a bent pin or a damaged tip can lead to many dropped cans!
INTERNAL SPRAY (LSM’S) – Internal lacquer application
For internal sprays, the recommendation would be for each machine to have a can count sensor at the input hopper of each machine and a can sensor at the output hopper of each machine, after the “Discharge Gate Jam” window, allowing the system to count the difference between the total cans fed and the total cans that came out of each machine. The waste for each machine will be the total cans discarded, times the total number of cans that came out of the machine. On the OVERVIEW SCREEN, I would recommend measuring the I/Spray process waste by the sum of the total number of cans scrapped, from all machines, divided by the Palletizer production.
It is not common for I/Spray machines to present a large discrepancy between them, so I believe that in the Overview screen it would be sufficient to present the average value of the set of I/Spray machines, and if the Supervisor sees the need for a more detailed query on the machines, he could click on one of them and access the overall evaluation set with individualized data for each one through the DIAGNOSTICS – INTERNAL SPRAY page.
NECKER – Necker Forming, Flange and Electronic Quality Inspection
In this example we are considering that the Necker is complete, producing 211×413-202 cans with the L.Tester and Internal Optical Inspector installed inside the Necker, running at 3,400 c.p.m, which would be the production bottleneck, so its OEE reflects the OEE of the production line.
I would recommend monitoring the inlet production with a sensor on the single channel hopper (in the example screen it is labeled SF1S3) and another sensor after the Necker on the tunnel outlet track (V3S3).
The total number of cans rejected by the Inspectors is controlled by the Necker’s PLC and can be taken directly from its PLC, also normally available to the operator on the equipment’s HMI, so the difference between the input and output can counters, plus the sum of the inspectors, is attributed to transfer jams between stations. If the Supervisor clicks on the Necker, he will access all the detailed data from the Necker and the L.Tester and Internal Inspection Inspectors, as well as the transfer jams per stage on the DIAGNOSTICS – NECKER page.
PALLETIZER – Packing cans for storage and sale
Finally, we have the Palletizer, and although this can also cause waste, what we have on the Overview screen would be the data from the Label Verifier System, which would have ejected 922 cans possibly with different labels or with a significant difference from the label standard. Any loss during palletizing would be the number of CONVEYORS.
The production of the Palletizer is based on the number of layers produced, and if we look at the production data presented in the Palletizer, we have 466 pallets, but in the value produced in the table we have a difference, because we have a pallet in process. The option of presenting only full pallets in the Palletizer is that normally the daily production target is by the number of pallets produced approved, and the actual production in the summary table with the data of the day.
Next is the OVERVIEW screen, which presents the overview of the line for the Shift Supervisor.
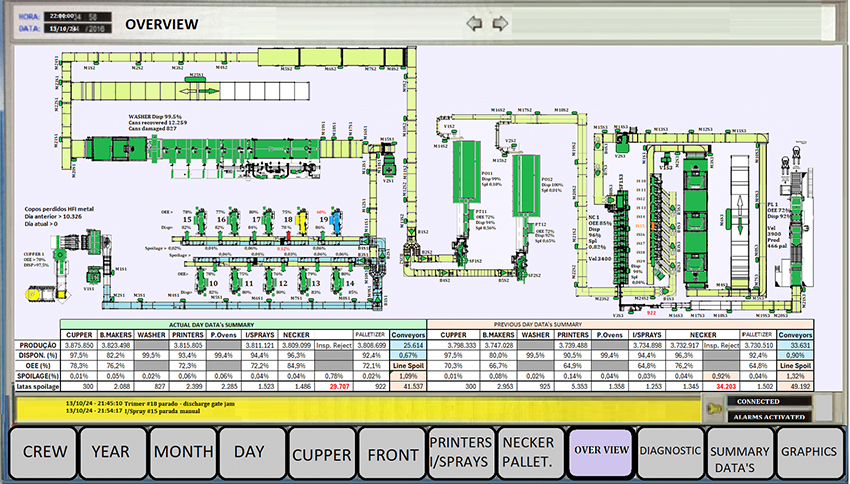
WE HAVE in the OVERVIEW the basic data of all the equipment and a summary table with data from the Current Day and Previous Day of the production line. We see that if we add up all the cans lost by the production of the Palletizer, there is a difference in relation to what was produced in the Cupper – registered in “CONVEYORS”.
The day’s line waste will be limited to the sum of CARRIERS + Line Waste, which can benefit from legacy cans from the previous day.
The “CARRIERS” data, representing 0.67% on the day, not all of it is waste, but a good portion may be overturned cans, as we see that the Necker accumulator table is almost empty, and if we compare it to the previous day, the number of CARRIERS is much higher, which leads us to believe that it received full accumulator tables, but there are also about 10K cups lost with coil HFI, which we can also see.
A good portion of CONVEYORS are cans dumped on the IBO and conveyor, so it is important to measure and monitor this data.
Knowing the macro of the previous day and the current day is important to take the necessary actions to improve the day’s performance.
From the data presented the previous day, the BM’s showed a worse performance possibly linked to metal issues, and in the Printers a significant drop in performance which may for example be related to the more complex labels that affected the previous day and although PT12 on the current day has some difference compared to PT11, the overall performance is in line with expectations. But something is going on at the Body Makers and requires the supervisor’s attention, as there is a BM at Low Speed all day, now at this close of the day’s shift, attention to the BM’s, especially BM 19 and Trimmer 18 require closer scrutiny. Small problems accumulated and unresolved are what lead to large production losses and waste in the month.
An important point is data validation. When creating a system like this, the data must be validated by directly comparing the collection inside the PLC with the data stored in the collection matrix, the values brought with item-by-item calculations displayed on screen by the line monitoring program, such as the theoretical example presented here.
When you work to control waste, you also work to improve line performance.
A line with low waste is usually also a line with high OEE, and it’s not because the production at the end of the line is higher, but because to have low waste requires an efficient maintenance system, an efficient measurement system, an efficient quality system. Waste is the sum of it all!
We see that on the screen we have the data to be analyzed, and I would like to highlight some points about this proposed screen.
Here we present our vision for observing the waste and performance of the Body Makers. Each team should have a diagnostic screen available, accessible by clicking on the team, or through the DIAGNOSTICS menu bar with a page for each team, or group as in our case.
We see the Cupper in the corner, which as it has a great influence on the BM’s, it is good to have the macro view of the Cupper when analyzing the BM’s Diagnostics. On the screen we have the macro data of the Cupper, and among them we bring next to the Coil Carr the control of cups discarded due to coil HFI due to quality problems, total of 10,326 from the previous day, which indicates that there was a problem with the metal coil the previous day. This must have impacted the level of scrap at the Body Makers and the previous day’s line performance. This number will also appear in CONVEYORS and may explain the difference in cup count with the previous day’s Palletizer.
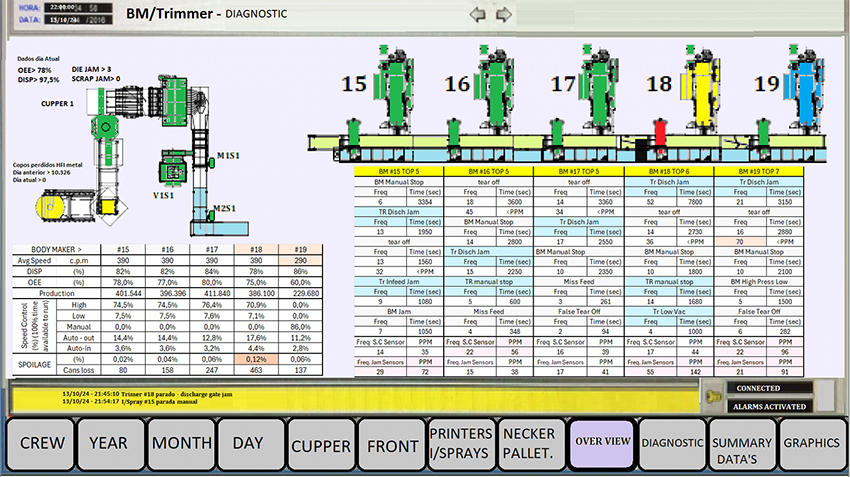
Following the Cupper is the macro data for each BM/Trimmer in the group on the right side of the BMs. I would highlight among them how the speed was distributed over the time available; the equipment was not stopped for maintenance/processing issues. If the Auto In is higher than expected, it may indicate that there is a Cupper performance issue that has affected the overall BM performance. If the Auto Out is too high compared to the daily average, a problem must have occurred in the back area, as the Washer is at 99.5% availability.
The option for the Supervisor to access the Graph area and select the indicators for the last few days would allow us to better compare and evaluate the current situation and would be accessible through the GRAPHICS menu bar. This can allow him/her to compare how he/she is doing in relation to the average, especially comparing with good days and underperforming days.
Below the Body Makers are the TOP 5, the 5 events that affected the BM with the most downtime, in order of time, also reporting the frequency of occurrence.
After the Top 5 there are always 2 points that we would consider crucial to performance, which are Short Can Sensor PPM, which includes all true and false Tear Off stops (if a tear off took less than 60 seconds to clear, it is probably a false tear off – sensor not calibrated correctly), and Jam PPM, which includes all jam stops at BM discharge, Trimmer feed, and Trimmer discharge. For example, values above 55 PPM (per million cans produced, 55 events) would be considered a hot spot, and would be highlighted on the screen to draw the observer’s attention. For Waste, we would consider values greater than 0.06% as a hot spot.
We see that machine #18 has a Wastage rate of 0.12%, and a Total Jams of 142 PPM, which alerts the Supervisor to look for the cause, which may be due to cans released in the BM with problems or a Trimmer head with a problem, or some other problem.
We see that in the Top 5 of this BM 18, among the 5 causes that caused more downtime in the BM are the disassembly of the Trimmer due to jamming at the outlet, manual shutdown and low vacuum, which should be investigated. The BM indicators are within the expected range, so the indicators induce us to look for the problem in the Trimmer.
Machine #19 has reasonable Waste, but the BM has problems. It is in the TOP 5 for stoppages due to low pressure from the high pressure system, as well as real and false tear offs, and clogs in the Trimmer discharge. A bad can can also cause clogs in the Trimmer, so this machine needs attention.
The Supervisor could check which equipment is easier to troubleshoot and try to solve one at a time so that the line can operate at a high level again, this shift and in the following shifts.
The previous day’s data led us to consider that the previous day was impacted by the back area and now appears to be performing well, with the front being the 2 BMs with problems.
BM #15 and #16 have an overall Clog or Short Can rating slightly above, troubleshooting the above two to verify why #15 has high Clog, which may be reducing its performance, and #16 could have false tear offs.
Low Waste needs high productivity. It is necessary to monitor and work on problems on a day-to-day basis to allow for continued good results, so that you have a closed month with low waste and high OEE.
Basic Maintenance Considerations
The line will perform well if the quality at the beginning is good, i.e. good cans in the Body Makers lead to good results at the end of the day, and this leads to low wastage. If you stop 1 BM every 45 days for preventive maintenance, but maintain adequate group performance during the period, with small corrective interventions, the monthly target will be reached. The line has 10 BMs, which allows stopping one machine at a time.
The machine chosen for preventive intervention should not only be based on the period in relation to the last intervention, but also on predictive, performance and quality indicators.
For the BM/Trimmer and I/Spray group, this is a good way to go. If everyone in the group is performing similarly, then the closest preventive date should be the choice, but never stop doing Preventives, this is what sustains the results in the medium and long term.
As for the printers and other unitary equipment, a program is needed to prevent production line stoppage, but as it is not the subject of this “document”, we will not detail it, because not only the production equipment depends on the result of the operation, but also on all the auxiliary systems, such as the Soluble Oil System, Compressed Air System, Vacuum System, Ventilation System, Cold Water System, Deionized Water System, etc.
A good practice for unitary equipment is the weekly “pit stop”, a scheduled line shutdown of 1 to 2 hours each week to resolve minor problems between major line shutdowns, which generally take 12 hours or more, usually focused on sanitizing the Washer and cleaning the ovens, printers, Neckers and Palletizers, as well as others that are not in group or stand-by. The Pit Stop avoids the accumulation of problems for preventive maintenance of the line.
Good maintenance is done with a good combination of:
- Preventive, based on the average life of the components and a good checklist. If you control everything that is replaced on each piece of equipment and have control of the average time needed for each replacement, and knowing how long each component is operating, this information can guide the action plan during the preventive shutdown. MRP systems, such as SAP, have the possibility that the stock of spare parts can be tracked with application, i.e. each OEM part with known consumption and average life. This is linked to the Material Register.
The worst failure is always the unexpected one because along with the failure of 1 component that was at the end of its life, several others will also be damaged as a result, increasing the cost and time for Emergency Corrective Maintenance.
- Predictive, with data from vibration analysis, thermography, oil analysis, evolution of Macro KPIs of the equipment, as well as analysis of standard deviation and average parameters of quality data.
- Corrective, guided by macro indicators of equipment performance at the present time, and often by the adequacy of quality parameters, with scheduled shutdowns throughout the production day.
Observation valid for the whole team, whether unitary or in group. When planning the shutdown, always maximize the benefit of the shutdown by resolving several minor problems in various areas. The entire team should be informed of the forecast and take the opportunity to resolve outstanding issues of which they are aware, such as recording outstanding issues in the team logbook.
Well-maintained equipment is the secret to low waste and good performance.
Each production phase needs indicators that guide the Supervisor to make assertive decisions on a daily basis, and never look for production records, but rather a high average, with teamwork, where each Class works so that the performance of the next Class is as good or better than yours.
We must not forget the quality system, sometimes it is a parameter variation, for example, a low inclination on a Reformer head, which will define the intervention to be performed, changing the tool set of the position with a marginal variation. Maintenance and Quality always go hand in hand!
Final Considerations:
The aluminum can market is a very competitive market that depends on volume for manufacturing cost and profitability. It is not uncommon to work with a net margin of 5%, even less.
Consider a budgeted scrap of 2% which, due to inadequate control, is at 4%. This increase in scrap would increase the cost of production because it reduces production and all the raw material and labor applied is lost, and only the partial value of the metal will be recovered in the recycling of the can.
Assume that the total budgeted production cost was $45.00/thousand, and the realized cost was $45.50/thousand, i.e., 2% of the waste cost $0.50/thousand.
What would this waste represent in annual costs for our standard line? If the expected average production for our line is 3.85 million cans/day and the plant has 345 budgeted operating days, the expected production per year is 1.325 billion cans/year, which leads to a waste cost of $662,500 U$/year. Every 1% of waste can represent an annual loss of 350KU$, which is why it is so important to control waste.
I hope this reading will be useful to readers and will help them in the analysis of their monitoring system.
Competitiveness starts with a good supervisory monitoring system and a good quality control system.
NOTES:
- The screens presented are not from a real supervision system, they were created from data generated with a logic that would lead us to be able to prepare this dissertation on the subject.
- Each can manufacturer has its own monitoring standard, which is likely to be different from the one presented here. The objective was to demonstrate concepts that can guide or revise the current system available to improve yield and waste.
- In the can business, competitiveness translates into high OEE and low waste, with a high perception of quality by customers. Equipment in good condition produces good cans.
- An observation that may seem very basic, but which is worth commenting on:
- PLCs are programmed to collect basic data in totalization blocks to transfer information as well as production counters to a collection matrix, which will be used by supervisory building software, such as Allen Bradley’s Factory Talk, to provide the information on screen.
- It is not recommended to perform calculations such as PPM, OEE, etc., inside the PLC of the equipment, to transfer to the database of the supervisory system. The system must be programmed to assemble the information from the basic data transferred by the PLCs.
- The waste cost calculation values are only a reference (a kind of magnitude), since the real cost depends on the reality of each site and may vary in production.
 Troubleshooting Using Traceability Codes on the Can
 The Can Decorator: Innovation and Technology in Aluminum Can Printing
 Aluminum as a key element in the manufacture of beverage cans
 Main defects of a 2pc aluminum can
 Understanding and addressing tears in bodymakers
 The training area and its domino effect
 The Bodymaker: A Key Component in Aluminum Can Production
 What is tool room
 Troubleshooting strategy for an aluminum beverage can production line
canning grain
Troubleshooting strategy for an aluminum beverage can production line
canning grain