KEY RESULTS
Aluminum cans are gaining more and more prominence due to several distinctive features, such as their easy stackability, light weight, strong, hermetically sealed lid, resistance to transportation, rough handling and easy recyclability, allowing brands to package and transport more beverages using less material.
The figures bear this out. The global aluminum cans market was worth $42.05 billion in 2020 and is expected to reach $55.31 billion by 2026. Precisely, the aluminum segment is estimated to dominate the metal food and beverage cans market, expected to reach 405.9 billion units by 2025.
FOOD AND BEVERAGE METAL CANS MARKET – GLOBAL FORECAST TO 2025
8.1 INTRODUCTION
High aluminum recycling rates and growing concern for sustainable packaging support the growth of aluminum in the metal can market. The steel segment is projected to grow at a compound annual growth rate of more than 6.3%, due to rising steel raw material prices.
Precisely, the most commonly used materials, such as aluminum and steel, for metal food and beverage packaging are constantly evolving, due in part to growing consumer demand for innovative, environmentally friendly, sustainable and cost-effective manufacturing processes.
According to the Canadian Association of Recycling Industries (CARI), 63% of aluminum cans are recycled annually. In addition, according to the Bureau of International Recycling (BIR), 1.6 million people work for the recycling industry. Around 45% of the world’s annual steel production, 40% of the world’s copper production and 33% of the world’s aluminum are produced from recycled material.
FIGURE 20 METAL CANS MARKET SIZE
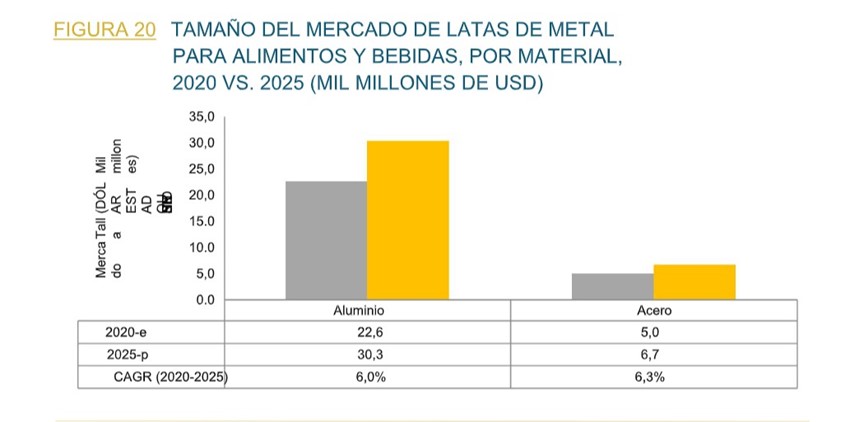
As the statistics show, aluminum continues to play a leading role compared to steel, with a 22.3% share last year, and is expected to reach 30.3% by 2025, an increase of 7.7%. In the case of steel, the figure remains stable, rising from 5.0% in 2020 to an estimated 6.7% in 2025, which confirms its stability.
FIGURE 21 METAL CANS MARKET SIZE
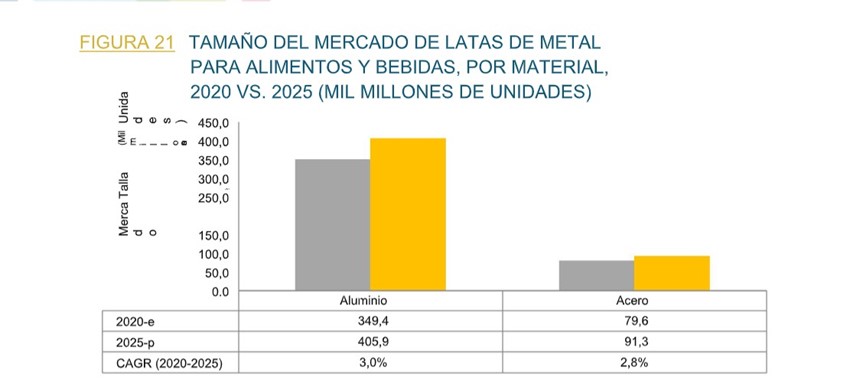
According to data for 2020, the market size of the metal cans for food and beverages market, by material, for aluminum was 349.4 while estimates for 2025 are expected to be 405.9, which represents an estimated increase of 3.0% over five years. In the case of steel use for metal packaging, this percentage drops drastically to 79.6%, although a slight increase is expected by 2025 to 91.3%, which translates into a percentage value of 2.8%, very similar to that of aluminum.
TABLE 15 METAL FOOD AND BEVERAGE CANS MARKET SIZE, BY MATERIAL, 2018-2025 (USD BILLION)

If we analyze steel from 2018 to 2025 the market size recorded in 2018 a volume in the market size of 20.0% recording a progressive increase in subsequent years to reach in 2020 a volume of 22.6, a trend that will continue to rise with an increasing estimate to reach 30.3%.
In the case of steel, this figure is merely representative, with a representative volume in the market of 4.4% in 2018 moving to 5.0 in 2020 and with a growth estimate for 2025 of 6.7%.
TABLE 16 METAL FOOD AND BEVERAGE CANS MARKET SIZE, BY MATERIAL, 2018-2025 (BILLION UNITS)

The market size of the metal food and beverage cans market, by material in the case of aluminum, in 2018 the volume aluminum cans was 328.4 billion units while in 2020 it was 349.4 billion units. The increase over five years has been 3.0%. If we analyze steel, the importance of this material is much lower in terms of volume of units manufactured. In 2018, it was 75.2 billion units with a progressive increase to 91.3 billion units.
FOOD AND BEVERAGE METAL CANS MARKET – GLOBAL FORECAST TO 2025
8.2 ALUMINUM CANS
8. 2. 1 100% RECYCLED ALUMINUM RATES MAKE IT SUITABLE FOR THE BEVERAGE INDUSTRY.
Aluminium is a very ductile material. It is derived from bauxite ore. It is the most preferred raw material and is used for packaging processed food and beverage products. Its low weight, impermeability and high flexibility make it a perfect material for packaging. Aluminium has wide applications in the beverage industry. It reduces the cost of transportation and works as an excellent barrier against air, light and microorganisms. It can be moulded into an infinite number of shapes. Aluminium is 100% recyclable and contains 35% recycled content. It can tolerate temperatures ranging from 40 degrees Celsius to 350 degrees Celsius. Aluminium cans have a better carbon footprint compared to other packaging materials used in the food and beverage industry.
Aluminum is a very cost effective raw material used in the food and beverage industry and can customize packaging with colors, 3D printing and embossing. Therefore, technological advances have led manufacturers to reshape their strategies by using various sizes of cans, along with different shapes. Aluminum cans are convenient to store in the refrigerator and in the oven. Recent years have seen changes in consumer preferences for food and beverage packaging. According to the U.S. Environmental Protection Agency (EPA), 1.9 million tons of aluminum beer and soda cans were generated, and 49.2 percent of aluminum beverage cans were recycled. Therefore, aluminum cans are estimated to dominate beverage applications, but have limited use in the processed food industry.
TABLE 17 ALUMINUM CANS MARKET SIZE, BY REGION, 2018- 2025 (BILLION USD)
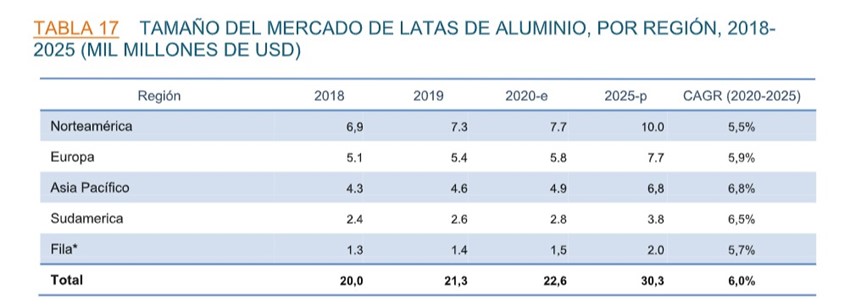
By country, North America continues to lead the market for aluminum cans. In 2018 this figure moved the figure of $6.9 billion while in 2020 the profit figure increased to $7.7 billion while estimates are expected to be by 2025 of $10 billion. This data confirms that North America has the largest market share in terms of revenue due to the growing concern for the use and consumption of sustainable packaging materials. It represents more than one third of total world consumption of aluminum cans.
Europe ranks second in revenue volume at $5.1 billion in 2018, rising to $7.7 billion by 2025. Third place goes to Asia Pacific, with $4.3 billion in 2018 although for the 2025 forecast it is expected to be $6.8 billion. The last place in the chart is occupied by South America, which recorded the second highest growth in five years, although the volume of operating units is the lowest in the table. In 2018 it posted a profit of close to $1.3 billion units versus $1.5 billion in 2020. However, growth expectations for South America, especially Brazil, are very optimistic for the next decade.
TABLE 18 ALUMINUM CANS MARKET SIZE, BY REGION, 2018-.
2025 (BILLION UNITS)
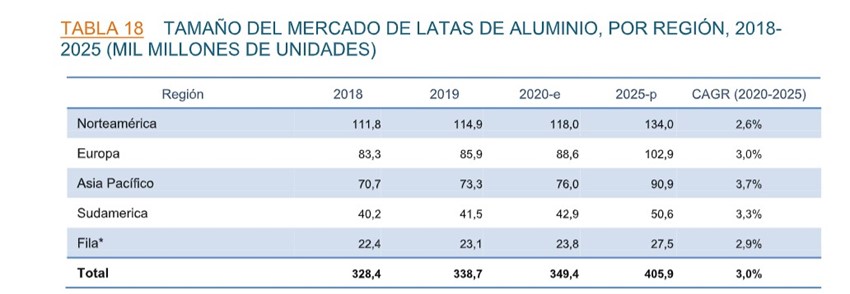
The presence of aluminum producers and demand from packaging companies is also driving growth in North America. According to the World Aluminum Organization, as of February 2020, 5,112 thousand metric tons of primary aluminum are produced worldwide, of which 312 thousand metric tons are produced in North America, which helps aluminum grow and can help the industry in this region. In North America, in 2018 the figure recorded was 111.8 billion units to 118 billion units in 2020.
In the case of Europe, who ranks second, in 2018 reached 83.3 billion units to increase this growth in 2020 which was 88.6 billion units. Asia Pacific in 2018 was 70.7 billion units although expectations for 2025 is 90.9 billion units. Finally, in the case of South America, in 2018 the volume was 40.2 billion units while expectations for 2025 are 50.6 billion units.
8.3 STEEL CANS
8. 3. 1 BENEFITS OF ALUMINUM LOWERING SALES OF STEEL CANS
Steel is one of the preferred metals for the manufacture of metal cans. There are two main types of steel grades for food packaging applications which are electrolytic tinplate (ETP) and electrolytic chromium coated steel (ECCS). Therefore, cans are mainly used to preserve processed foods, seafood, dairy products, syrups, and bakery and confectionery products. Steel represents only a small part of the market as steel cans are commonly used to store food products.
Until recently, tin and steel were used for the manufacture of cans, but gradually steel began to lose ground in the beverage industry to aluminum. Tin was adopted as an internal coating in the manufacture of cans to prevent corrosion caused by internal reaction.
It also prevents oxidation. The internal tin coating helps to protect the taste of food products. Steel cans are mainly used to preserve processed foods, seafood, dairy products, syrups, and bakery and confectionery products. Steel therefore represents the smallest share of the beverage market.
TABLE 19 STEEL CANS MARKET SIZE, BY REGION, 2018-2025 (BILLION USD)
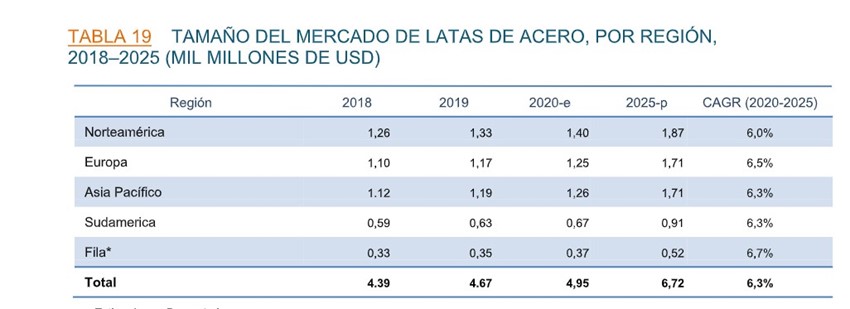
If we analyze the size of the steel can market by region, North America also holds the lead in terms of steel can production. In 2018 it recorded a profit volume of close to $1.26 billion although estimates for 2025 are expected that this profit figure will be higher with a profit estimate hovering around $1.87 billion.
In the case of Europe, it lags behind with 2018 profit volume reaching $1.10 billion versus $1.25 billion while keeping the profit margin stable.
Asia Pacific, recorded a higher profit in 2018 than Europe but this trend does not seem to be deflating and maintains the upward trend with a profit equal to Europe of $1.71 billion by 2025. In the case of South America, the profit margin drops by half recording a profit in 2018 of around US$0.59 billion, a figure that will increase slightly to US$0.91 billion.
TABLE 20 STEEL CAN MARKET SIZE, BY REGION,
2018-2025 (BILLION UNITS)
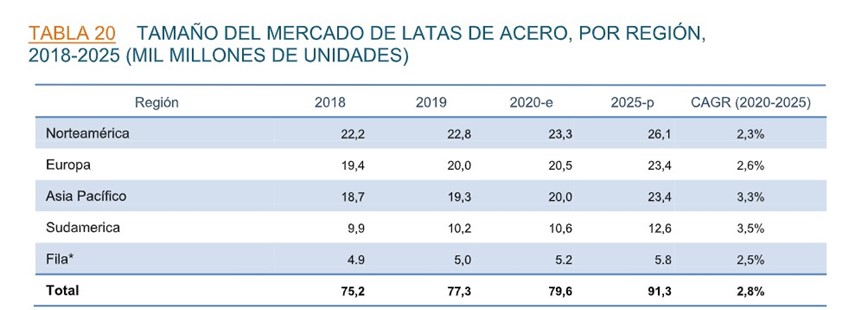
If we analyze the steel can market, North America also holds the leadership in this segment. In 2018, it recorded a production volume hovering around 22.2 billion units, a trend that is on the rise reaching a volume of 23.3 billion units with a 2025 growth estimate of 26.1 billion units.
Second in the table is Europe, with volume close to $19.4 billion in 2018, moving to 20.0 in 2019 to reach the 2015 growth forecast of 23.4 billion units produced. Asia Pacific ranks third in the analysis with a production volume of 18.7% to reach the same growth forecasts as its European counterpart by 2025. Last is South America with a production volume close to 9.9 billion units, in 2019 with 10.2 billion million units produced and by 2025 the forecast is expected to be 5.8 billion units.







Good morning
I really enjoy the Mundolatas magazine. Currently is the only publilcation I read in details, due to the precision of the information in it, mainly regarding market data on aluminum and steel cans.
I would like to kindly suggest you the separation of aluminum beverage and aluminum food cans information, despite the small figures for food aluminum cans, it still imput some contamination to the aluminum beverage cans market size.
Please don’t take my ycomment as a complain, no way. I just would like to see those numbers 100% free of any kind of contamination.
May I also suggest you contact ABRALATAS (https://www.abralatas.org.br), the Brazilian aluminum beverage can makers association in order to get thir official number form Brazil market.
Thank you for your dedication to prepare and issue this very important digital magazine.
At your disposal.
Bes regards,
Luiz Machado Neto
Dear Luiz Machado,
Thank you for your feedback and for your appreciation of Mundolatas magazine. I understand your suggestion about separating the information on aluminum beverage and food cans in order to provide more accurate market data. However, it might be challenging to separate the two as the market is interconnected and the numbers can be influenced by various factors. Nevertheless, I will certainly pass on your suggestion to our editorial team for their consideration.
Regarding your suggestion to contact ABRALATAS, we appreciate the suggestion and will consider reaching out to them for official numbers on the Brazilian market.
Thank you again for your support and suggestions, and we will continue to strive to provide high-quality information in our magazine.
Best regards,
Mundolatas Team