Market overview
Metal cans are containers made mainly of materials such as aluminum or steel, designed for packaging and preserving various products, such as beverages, food and beverages… The metal can market has experienced substantial growth in recent years, driven by a combination of factors. One of the main ones is the growing demand for packaging and sustainable solutions. Metal cans offer advantages such as recyclability, durability and resistance to external elements, making them an attractive option for both manufacturers and consumers.
Despite the positive trends, the market for metal cans faces certain limitations. The volatility of raw material prices, especially aluminum and steel, can affect production costs. In addition, concerns about the environmental impact of metal extraction processes contribute to the challenges faced by the industry.
In 2023, the global metal cans market reached USD 71,173 million and is expected to reach USD 124,220.89 million by 2030. The The “Compound Annual Growth Rate” is 8.5% for the period 2022 to 2030.
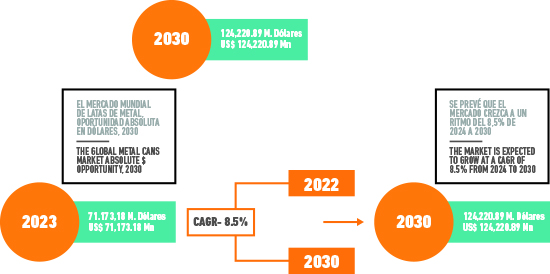
Executive Summary.
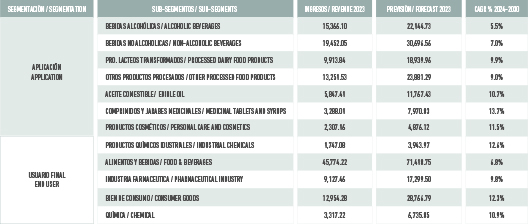
Two segments, application and end user, are analyzed in the following graph. In the first section, medicinal tablets and syrups is the segment with the highest percentage with 12.6%, followed by cosmetics and personal care products with 11.5%, while alcoholic beverages are the sub-segments with the lowest percentage. In the second case, consumer goods continue to account for the highest percentage of growth with 12.3%.
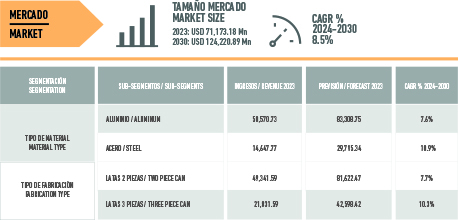
In the case of types of metals, aluminum has a 7.6% CAGR, while steel has a 10.9% CAGR. In the case of two-piece cans, the percentage is 7.7%, while for three-piece cans it is 10.3%.
Key points
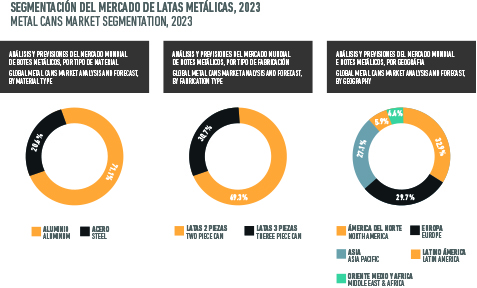
The Asia-Pacific metal can market is growing at a significant CAGR of 12.8. Aluminum continues to be the material that drives the sector, accounting for 71.1% of the market, followed by steel with 20.6%. Likewise, two-piece cans continue to be the most demanded with 69.3% of the demand compared to 30.7% for three-piece cans. By country, Europe continues to account for 29.7%, followed by Asia Pacific with 27.1% and North America in third place with 31.9%. Within the North American region, the U.S., the U.S. and the U.S. had the largest share of 68.8% in 2023 and is expected to dominate until 2030.





0 Comments