
There is no doubt that the soda cans are a true feat of engineering and represent a true story of achievement. Curiously, in its 85 years of existence as a commercial product, cans have been the paradigm of the Circular Economy. Since their appearance in 1935, they have done nothing but reduce the consumption of raw materials and energy for their manufacture and are currently the most recycled containers worldwide, and one of the best options for packaging all types of beverages.
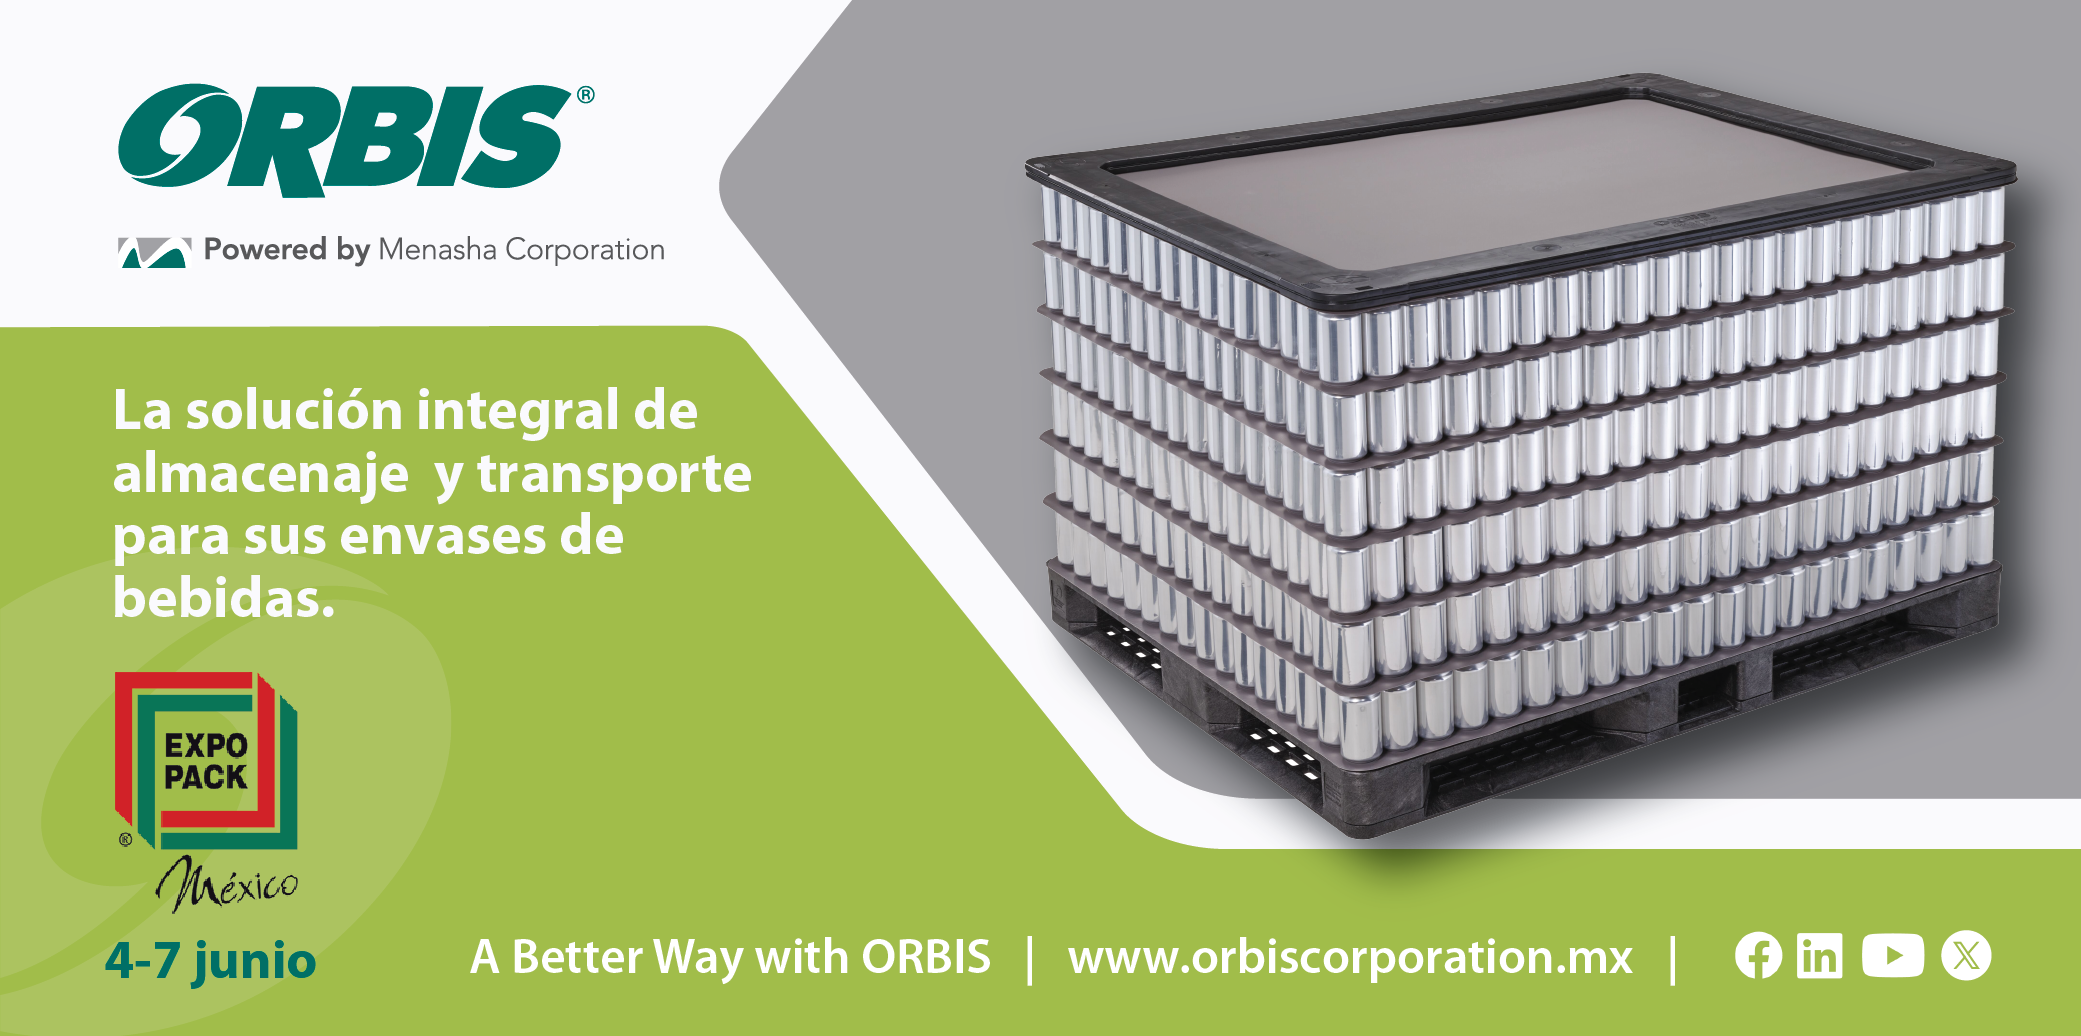
The cans are designed to be optimally stackable, so the base of one can fits snugly over the lid of the can below it. In addition, because of its shape, a perfect cylinder needs less storage and transport space, less than any other type of container of the same capacity. Of the total weight transported, more than 90% is beverage.
The can is the most leak-proof container, as the metal forms a perfect barrier. This is why beverages last longer in cans and have a longer best-before date. In addition, metal, unlike plastic and glass, is absolutely opaque, which prevents beverages from deteriorating due to the action of light.
They are also the containers that cool more quickly in the refrigerator, thanks to the fact that metal is a better thermal conductor than glass or plastic. Cooling a canned beverage requires less energy than any other option.
Today’s soda cans are very light. The traditional 330 ml aluminum can weighs just over 12 grams. It is one of the packages that has reduced its weight the most thanks to technological advances.
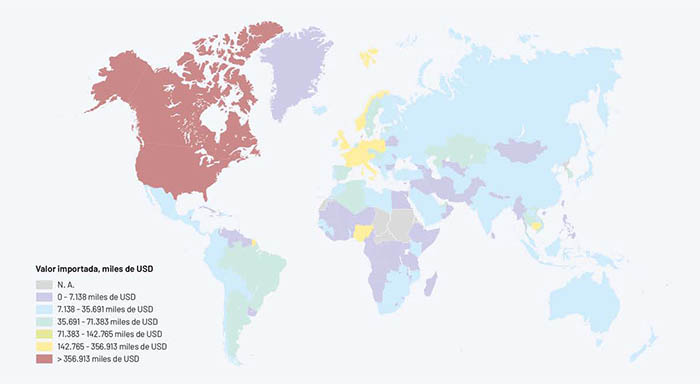
1. IMPORTING COUNTRIES
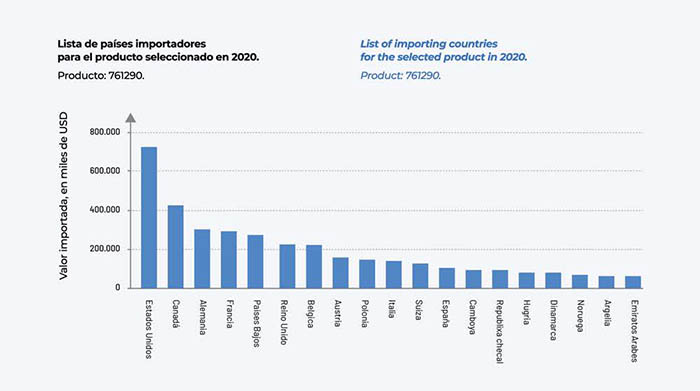
IN 2020, the United States was the world’s leading aluminum can importing country by exceeding 700 billion imported containers. Far behind, with almost half of the metal cans, is its neighboring country, Canada, with slightly more than 400 billion cans. In third place in the statistics is Germany with nearly 300 billion units, followed closely by France with a very similar figure. On the other hand, the United Arab Emirates is at the bottom of the ranking.
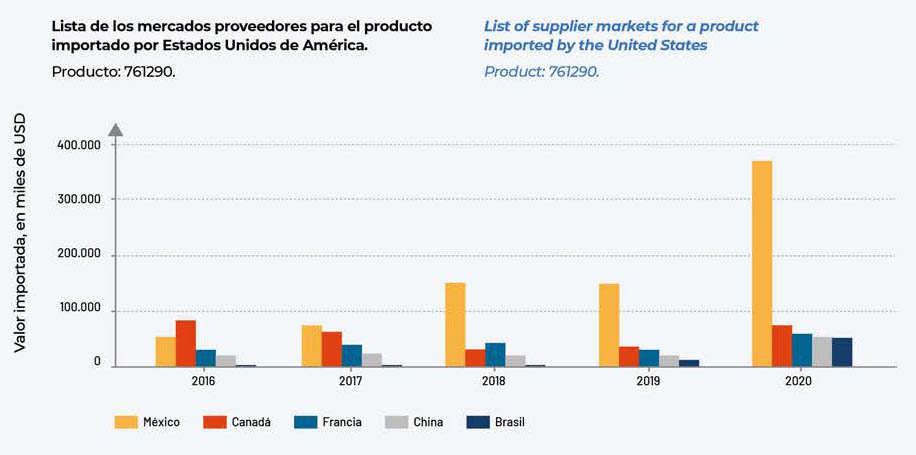
1.1 UNITED STATES
The North American giant is once again the market leader in the aluminum can sector. According to the analysis carried out for 2020, imports by the US that year were stratospheric with almost 400 billion units coming mostly from the Aztec country, Mexico, as the main supplier, compared to Canada with less than 50 billion units, followed by France, China and Brazil with very similar figures. Its significant progress is surprising if we compare it with 2019 as well as with previous years since Mexico exported to the United States that year close to 120,000 million units, a quarter if we compare it with the following year with 390,000 million USD, which comes to demonstrate the spectacular growth of the sector as well as the important demand for this type of metal packaging.
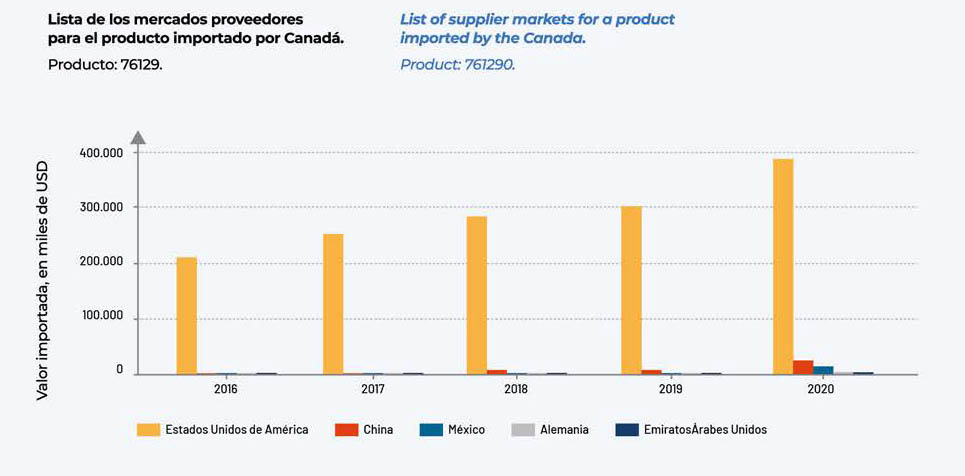
1.2 CANADA
In the case of Canada, its neighboring USA has been the main and almost sole supplier of packaging for years. In 2016 it slightly surpassed the 200 billion unit figure increasing slightly in the following years in a progressive manner until almost touching 400 billion units sold to Canada in 2020. China, Mexico, Germany and the United Arab Emirates also appear in the statistics, but with barely representative values.
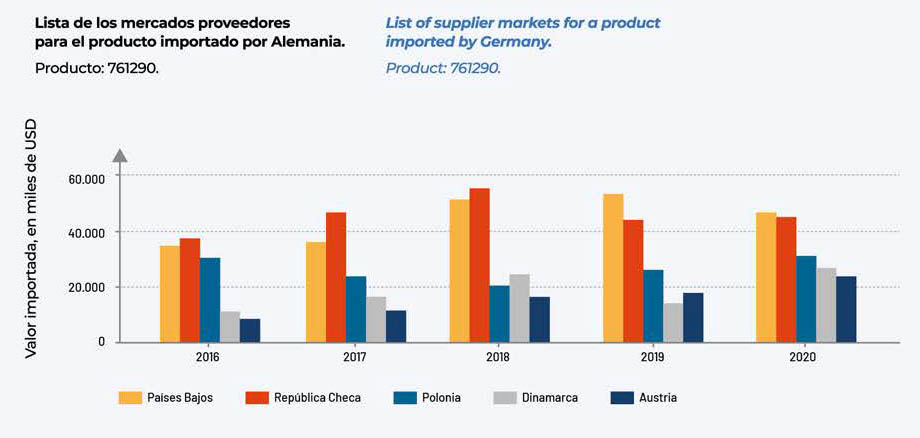
1.3 GERMANY
The German giant is one of the largest beer consumers in the European Union, consolidating its long-standing leadership. Looking at the can suppliers for the German-speaking country, Czech Republic is at the top of the list as the main supplier from 2016 to 2020. The first year of the series reached 40 billion units while the highest figure was in 2018 after almost touching the 60 billion unit barrier for aluminum cans reducing that number slightly and dropping to 45 billion imported units. The second of the exporting countries is the Netherlands with similar figures to its predecessor, but almost surpassing it in 2019 with 59 billion units. Poland, Denmark and Austria are other countries supplying Germany, but with very distant values.
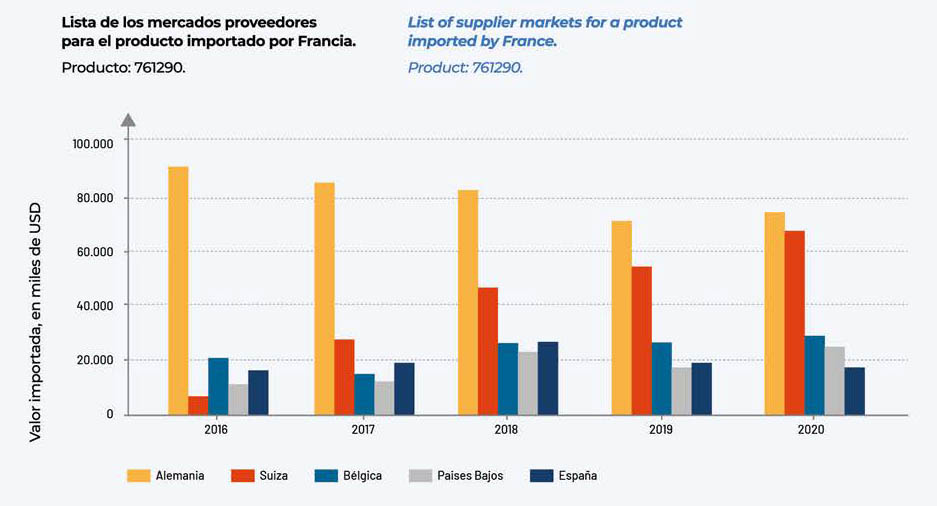
1.4 FRANCE
France also benefits from its geographical proximity to meet its demand for aluminum containers. In 2016 its main distributor, with 90 billion units sold was Germany, a trend that has declined slightly in subsequent years but whose demand has been maintained with an average of 80 billion units with 2019 being the year in which that trend declines slightly with 70 billion units purchased by France.
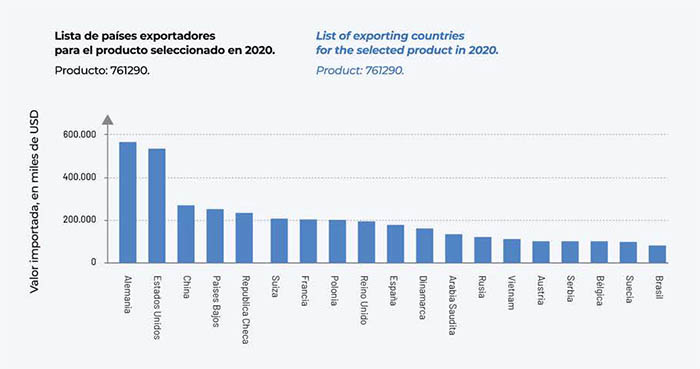
2. EXPORTS
In terms of global exporting countries, Germany leads the list in 2020 with 550 billion units, followed by the United States with 500 billion aluminum cans, which is close behind. China is the third country in the statistical ranking whose exporter values drop by half with USD 250 billion, which places Germany and the USA as the main suppliers of aluminum cans worldwide, well above the rest of the competitors, which also include the Netherlands, the Czech Republic and Switzerland. Spain is in the middle of the table with less than 200,000 million units exported.
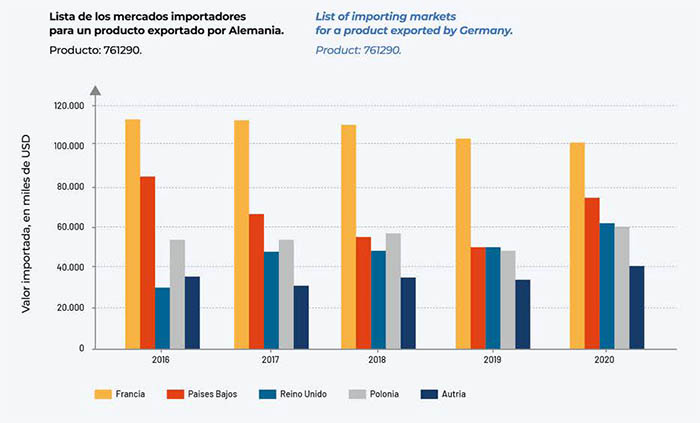
2.1 GERMANY
If we analyze the list of import markets for products exported by Germany we find that France is the leader during the historical series between 2016 to 2020 reaching the first year almost 110 billion units and slightly declining in the last two years to stand at the 100 billion units barrier. The next largest country is the Netherlands with 80 billion units, a figure that declines slightly in the following years until it recovers to USD 75 billion in 2020. It is followed by the United Kingdom, which exceeds USD 30 billion, more than doubling the figure in four years, and Poland and Austria with slightly lower values, in the latter case with almost 40 billion units in the last period of the historical series.
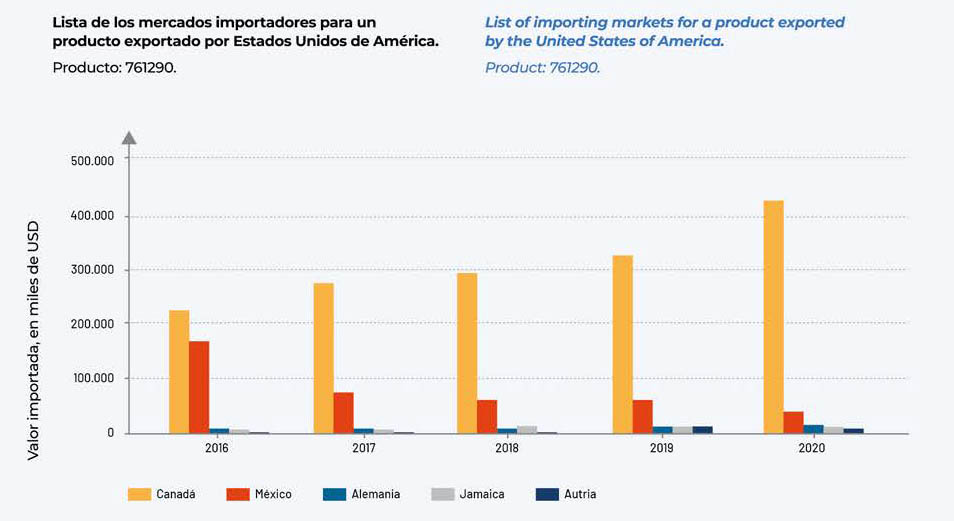
2.2 UNITED STATES
If we analyze the list of import markets for aluminum cans exported by the United States, we find that Canada is at the top of the ranking, leading the trend throughout the historical series. In 2016 it surpassed the 200 billion unit can barrier with a progressive increase over the following years to exceed USD 400 billion in 2020. Far below is Mexico with 150 billion units in 2016 while there is a gradual decline in subsequent years to stand at USD 50 billion in 2020. The participation of other countries that appear on the list, such as Germany, Jamaica and Austria, is practically minimal, with very low values.
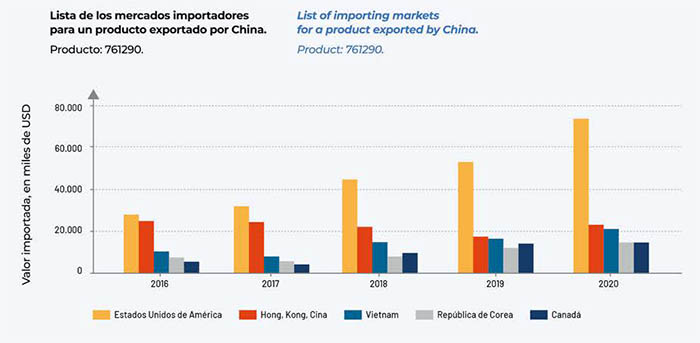
2.3 CHINA
China as the economic giant that it is in relation to importing markets for exporting packaging are at the top of the list United States 21 billion USD in 2016 with an exponentially progressive growth during the historical series reaching 2018 surpassing 40 billion units to almost double the figure and reach almost 80 billion USD beating all records in the historical series against its competitors. It is followed in second place by Hong Kong China with 20 billion units, maintaining that figure over the four-year period. Other countries also appear on this list, such as Vietnam, Korea and Canada.
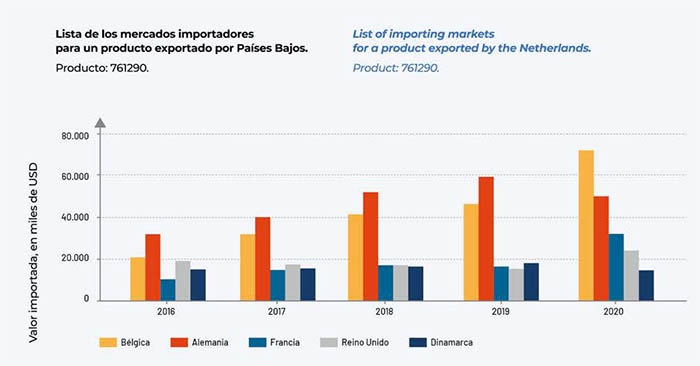
2.4 NETHERLANDS
Finally, mention must be made of the Netherlands. If we analyze the list of import markets for the cans exported by the Netherlands, Germany is at the top of the statistics. From 2016 to 2019 it goes from 30,000 million units at the beginning of the historical series to almost 60,000 USD while in 2020 Belgium takes the top spot with 70,000 units unseating Germany. France, the United Kingdom and Denmark recorded similar values with an average of 19 billion units.
 ALUMINUM BEVERAGE CAN INDUSTRY SECTOR GROWS FOR THE FIFTH CONSECUTIVE YEAR
 MARKET STUDY ON CROWN CORK
 TOAST WITH ALUMINUM BALL CANS TO CELEBRATE THE BIG SUPER BOWL GAME
 Aluminum beverage cans remain the most sustainable beverage package in the US.
 BALL ARENA PROMOTES THE USE OF ALUMINUM BEVERAGE CONTAINERS
 ONE MILLION RECYCLED ALUMINUM CANS FOR THE MAKE-A-WISH FOUNDATION
 CANNED WINE TRIUMPHS AMONG SPANISH MILLENNIALS
 Envases Group expands its aluminum can production facilities now in Texas
 Making a can from recycled aluminum saves more than 90% of the energy needed to make a new can.
 Price of empty soda cans
0 Comments